National Population and Housing Census 2021 held on November 2021
Top 5 districts with highest population growth rate
| wdt_ID | Districts | Population | Growth Rate |
|---|
Top 5 districts with lowest population growth rate
| wdt_ID | Districts | Population | Growth Rate |
|---|
Province-wise Urban-Rural Population
| wdt_ID | Province | Area | Population | Percentage |
|---|
Population by Ecological Region (as of preliminary census report 2021)
| wdt_ID | Ecological Region | Census 2011 | Census 2021 | Annual Population Growth Rate | Decennial Change | Percentage |
|---|
Top 5 districts with highest population
| wdt_ID | District | Total Population | Male | Female | Percentage of National Population | Average Household size | Annual growth rate |
|---|
Top 5 districts with lowest population
| wdt_ID | Districts | Total | Male | Female | Percentage of National Population | Average Household size | Annual growth rate |
|---|
Population by district
| wdt_ID | District | Number of House | Number of Household | Total Population | Male | Female | Gender Ratio | Average Household Size | Population Density | Annual Growth Rate (%) |
|---|


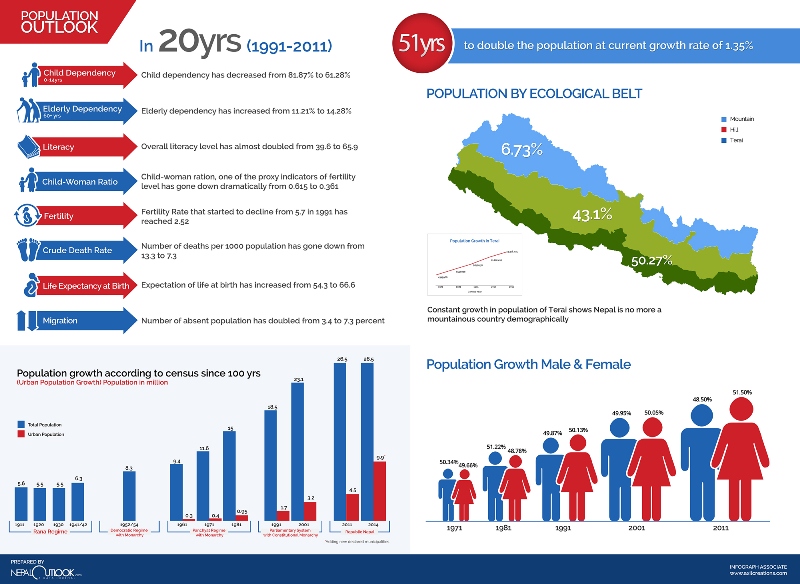
The most recent population census held in 2011 enumerated a population of 26,494,504 with a male: female ratio of 94.2:100. It was the eleventh census in series, started in 1911. Next census will be in 2021. It is reported that the first nationwide census was taken before the middle of 19th century, and then census have been held at regular intervals since. The result of any such early censuses are however unknown.
The Population growth rate between 1981 and 1991 was 2.08 percent; it jumped up to 2.25 between 1991 and 2001 Census. Population growth rate has drastically decreased to 1.35 percent in between the census years 2001 and 2011. The recently held census shows that 35% of population is children below 14 years of age and 8% of population is elderly i.e. 60+ years.
Population Growth Rate
The earliest available data on population are from the population census held in 1911 when a total count of 5,638,749 was recorded. Subsequent censuses were held in 1920, 1930, 1941, 1952/54, 1961, 1971, 1981, 1991, 2001& 2011. Nepal’s current population is 3.3 million greater than of 2001 census. There were 23.1 million populations in 2001 census and it was around 4.6 million greater than in 1991census. The main component of Nepal’s population growth has been natural increase.
The population size, growth and density vary according to geographical and administrative divisions. The geographical distribution of the population is not equal but it is dense in some places and sparse in others. There are urban centers where thousands of people live within a few square kilometers, and there are vast stretches of mountains where the population averages only one two persons per square kilometers. The share of total population in terai is increasing year by year. It is true, that fertility, mortality and also boundary changes are the contributing factors in the population size, growth and distribution by geographical and administrative divisions. A variation in the net migration is also responsible for special changes in the population in the country. Aside from the total size, the most important demographic characteristics of the population are its age and sex structure.
Population projections are extremely needed for making development plans at national and sub-national levels. In Nepal, the sub-national levels may be urban-rural, development regions, ecological zones, districts and federal areas which have come into existence after the promulgation of the new constitution. Based on 2011 Census a 20-year projection has been assumed in the interval of 5 years.
Central Bureau of Statistics has brought out the Population Projections for Nepal 2011-2031 based on the results of the National Population and Housing Census 2011 (NPHC-2011). The projection is one of the special post-census activities carried out by Central Bureau of Statistics (CBS) Nepal.
Projections have been made for the National level, urban areas, district level at an interval of five years. In this way, the projected population has been computed at other sub-national level i.e. ecological belts, development regions and eco-development regions. By and large, the report published encompasses all the projected population by sex and five year age group. As per the projection the current population of Nepal at high variant is estimated to be 3,01,16,424. It will reach 3,41,83,813 by 2031 at high variant.
The High variant represents slow decline in fertility, plausible decline in mortality and appropriate effects of migration levels which will give the higher estimates of population size. The Medium variant represents plausible decline in fertility and mortality levels along with appropriate effects of migration levels which will give the most likely estimates of population size. The Low variant represents fast decline in fertility, plausible decline in fertility and appropriate effects of migration levels which will give lower estimates of population size in years to come. In this way, population projections are made for three variants for a period of 20 years starting from 2011 at an interval of 5 years with the final year 2031.
Population by Province
| wdt_ID | Region | Total | Female (%) | Male (%) | Avg HH size | Sex Ratio |
|---|---|---|---|---|---|---|
| Region | Total | Female (%) | Male (%) | Avg HH size | Sex Ratio |
